2018 Grant Park Market Update
 It was another stellar year for Atlanta’s Grant Park real estate market! While we didn’t have quite as many home sales and listings took a bit longer to sell, we still saw an impressive increase in home values in 2018. Check out the latest market update below and see if this is a good time to sell or buy a home in this charming Historic ::::::::: Atlanta neighborhood. Enjoy!
::::::::: HOME SALES
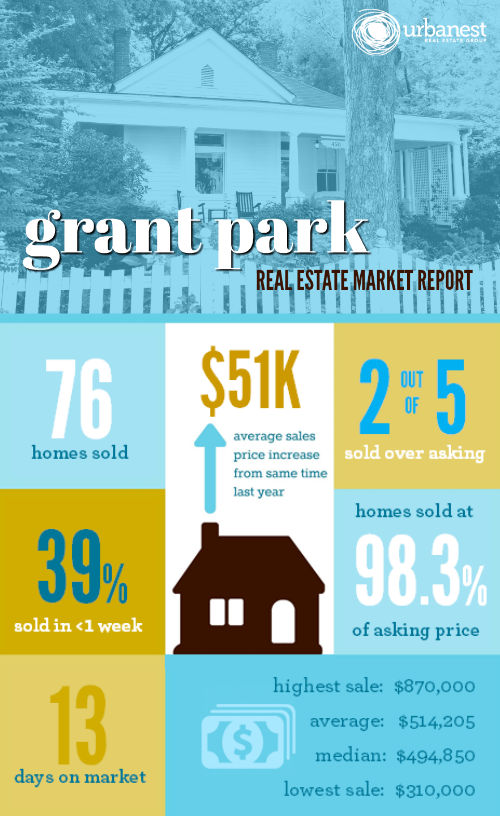
76 homes sold in Atlanta’s Grant Park neighborhood (zip code 30312) in 2018. This was down by about 10% from the previous two years, most likely due to fewer homes on the market… and a dwindling number of homes that are under $500K. At the time of this report, there are 15 homes for sale in Grant Park and only THREE are under $500,000.
See all the recently sold homes in Grant Park at the bottom of this report…
::::::::: HOME PRICES
The average single-family home sales price is $514,205. That is up $51,500 from 2016 — an impressive 11% increase in Grant Park home prices year over year!
* Single-family home prices ranged from $310,000 to $870,000 in 2018
* The median sales price was $495,000 (up $23K from the previous year)
* Almost 10% of the homes sold in Grant Park were new construction
::::::::: CLOSING COSTS
One popular question we receive from our Atlanta home sellers is “Will buyers ask us to pay all or part of their closing costs?” The answer is… sometimes.
Typically, buyer closing costs are 3% to 4% of the purchase price. With an average sales price of $514K in Grant Park, that means the buyer will need $15,000 to $20,000 — in addition to their downpayment, Because the real estate market is SO competitive right now with multiple offers and bidding wars, buyers don’t typically ask for the seller to pay for all or any of the closing costs…. but that could change in the years to come. In 2018, sellers contributed $4,307 on average toward buyer closing costs.
::::::::: HOW QUICKLY ARE GRANT PARK HOMES SELLING?
in 2018, homes sold in an average of 26 days — 4 days faster than in 2017. The median # of days to sell a home in this popular Atlanta neighborhood was only 13 days is most likely a more accurate representation of the current Grant Park real estate market.
An impressive 39% of the homes sold in ONE WEEK or less!
*** Scroll to the bottom of this report to see all the Grant Park home sales, including how long it took to sell each listing. The last column is called “DOM” and that stands for “Days on the Market”.
:::::::: ARE BUYERS STILL WILLING TO PAY TOP DOLLAR?
Absolutely! The median list price to sales price percentage is 98.3%, so buyers are negotiating a little less than 2% off the sales price (on average).
To put this in perspective, if your home was listed at $500,000, it will sell for about $491,500 on average. Knowing this, we highly recommend that you don’t “pad” your home’s listing price, as a fairly priced home will often generate multiple offers and sell at or over the asking price.
In 2018, 43% of the homes in Grant Park sold at 100% or more of the asking price.
Have questions about Grant Park Park real estate market or recent home sales?
Call the UrbaNest Atlanta team anytime at 404-205-8800.
Current Homes for Sale in Grant Park
Grant Park Homes Sold in 2018
Single-family home sales :: January 1, 2018 to December 31, 2018
| ADDRESS | BED | BATH | LIST | SOLD | TDOM | |
| 742 | Mercer St | 5 | 4 | $874,900 | $870,000 | 9 |
| 732 | Mercer St | 5 | 4 | $839,900 | $839,900 | 10 |
| 712 | Mercer St | 5 | 4 | $839,900 | $835,000 | 26 |
| 728 | Mercer St | 4 | 3 | $819,900 | $819,900 | 7 |
| 718 | Mercer St | 4 | 3 | $799,900 | $819,900 | 159 |
| 722 | Mercer St | 4 | 3 | $819,900 | $819,900 | 65 |
| 513 | Oakland Ave | 5 | 4 | $824,000 | $815,000 | 38 |
| 738 | Mercer St | 4 | 3 | $799,900 | $811,800 | 66 |
| 347 | Park Ave | 4 | 3 | $769,900 | $750,000 | 2 |
| 441 | Park Ave | 5 | 3 | $750,000 | $750,000 | 0 |
| 428 | Woodward Ave | 4 | 3.5 | $799,000 | $720,000 | 78 |
| 550 | Boulevard | 4 | 2.5 | $654,900 | $687,000 | 4 |
| 626 | Boulevard | 4 | 3 | $680,000 | $660,000 | 20 |
| 450 | Loomis Ave | 3 | 2 | $650,000 | $650,000 | 4 |
| 942 | Boulevard | 3 | 2.5 | $650,000 | $640,000 | 17 |
| 772 | Boulevard | 4 | 3.5 | $655,900 | $615,000 | 50 |
| 465 | Bryan St | 4 | 3.5 | $599,000 | $595,000 | 18 |
| 395 | Sydney St | 4 | 2 | $589,000 | $580,000 | 13 |
| 532 | Hill St | 3 | 2.5 | $560,000 | $575,000 | 2 |
| 375 | Glenwood Ave | 4 | 3 | $634,900 | $575,000 | 46 |
| 976 | Gress Ave | 4 | 3.5 | $569,900 | $569,900 | 7 |
| 767 | Lynwood | 5 | 4.5 | $575,000 | $567,800 | 12 |
| 481 | Oakland Ave | 3 | 3 | $560,000 | $565,100 | 6 |
| 669 | Berne St | 4 | 3 | $575,000 | $555,000 | 26 |
| 623 | Rosalia St | 3 | 2 | $525,000 | $534,500 | 4 |
| 411 | Glenwood Ave | 3 | 2 | $545,000 | $534,000 | 5 |
| 719 | Ormewood | 3 | 2 | $525,000 | $528,000 | 26 |
| 676 | Home Ave | 4 | 3 | $525,000 | $527,000 | 5 |
| 466 | Sydney St | 3 | 2 | $525,000 | $525,000 | 9 |
| 763 | Rosedale Ave | 3 | 3 | $549,000 | $518,000 | 18 |
| 507 | Boulevard SE | 3 | 2 | $549,000 | $513,500 | 63 |
| 543 | Grant St | 3 | 2 | $525,000 | $510,000 | 13 |
| 539 | Grant St | 3 | 2 | $550,000 | $500,000 | 76 |
| 455 | Grant St | 4 | 3 | $539,900 | $500,000 | 37 |
| 707 | Hansell | 3 | 2 | $515,000 | $500,000 | 5 |
| 252 | Sydney St | 3 | 2 | $525,000 | $500,000 | 22 |
| 651 | Mcdonald St | 3 | 2 | $499,900 | $495,000 | 21 |
| 521 | Bryan St | 4 | 3 | $499,900 | $495,000 | 10 |
| 316 | Cameron St | 4 | 3.5 | $550,000 | $494,700 | 62 |
| 500 | Waldo St | 3 | 3 | $489,900 | $489,900 | 7 |
| 635 | Cameron | 3 | 2 | $475,000 | $475,000 | 2 |
| 696 | Delmar Ave | 3 | 2 | $450,000 | $475,000 | 7 |
| 609 | Mead St | 3 | 2.5 | $500,000 | $473,000 | 86 |
| 696 | Berne St | 3 | 2 | $450,000 | $465,000 | 5 |
| 233 | Georgia Ave | 4 | 2.5 | $469,000 | $465,000 | 1 |
| 695 | Woodward Ave | 4 | 1 | $455,000 | $455,000 | 7 |
| 707 | Confederate Ave | 3 | 3.5 | $465,000 | $450,000 | 42 |
| 592 | Waldo St | 2 | 2 | $425,000 | $436,000 | 5 |
| 350 | Woodward | 2 | 2 | $425,000 | $435,000 | 3 |
| 432 | Oakland Ave | 3 | 3 | $425,000 | $430,000 | 4 |
| 470 | Kelly St | 3 | 2 | $425,000 | $427,000 | 11 |
| 980 | Boulevard SE | 2 | 2 | $425,000 | $425,000 | 18 |
| 775 | Rosedale | 2 | 2 | $400,000 | $412,000 | 4 |
| 485 | Glenwood Ave | 3 | 2 | $435,000 | $410,000 | 61 |
| 648 | Glenwood Ave | 2 | 2 | $435,000 | $409,000 | 67 |
| 232 | Clarke | 3 | 2.5 | $429,900 | $400,000 | 32 |
| 300 | Glenwood Ave | 3 | 2.5 | $415,000 | $399,000 | 16 |
| 328 | Sydney St | 2 | 2 | $400,000 | $396,600 | 2 |
| 653 | Killian St | 3 | 3 | $419,000 | $390,000 | 119 |
| 757 | Rosedale Ave | 2 | 2 | $389,900 | $389,900 | 7 |
| 580 | Hill St | 3 | 3 | $450,000 | $389,000 | 64 |
| 889 | City Park Dr | 3 | 2 | $400,000 | $385,000 | 60 |
| 747 | Confederate Ave | 2 | 2 | $359,000 | $378,000 | 14 |
| 856 | Rosedale Ave | 3 | 2 | $375,000 | $370,000 | 6 |
| 710 | Hamilton Ave | 3 | 2 | $379,900 | $365,999 | 87 |
| 463 | Hill St | 3 | 2 | $365,000 | $365,000 | 4 |
| 514 | Connally St | 3 | 2 | $369,900 | $364,000 | 5 |
| 645 | Ormewood Ave | 3 | 2.5 | $325,000 | $352,000 | 9 |
| 535 | Connally St | 3 | 2.5 | $344,900 | $340,300 | 8 |
| 615 | Delmar Ave | 3 | 2.5 | $359,900 | $340,000 | 52 |
| 318 | Glenwood Ave | 2 | 2 | $325,000 | $335,000 | 9 |
| 634 | Delmar Ave | 4 | 2 | $390,000 | $335,000 | 5 |
| 495 | Kelly St | 2 | 1 | $334,000 | $334,000 | 0 |
| 330 | Glenwood Ave | 2 | 2 | $324,900 | $332,000 | 18 |
| 330 | Grant St | 2 | 2.5 | $325,000 | $316,000 | 20 |
| 649 | Mcdonald St | 2 | 2 | $315,000 | $310,000 | 36 |
The Grant Park real estate market and home sales data was extracted from the Atlanta Georgia FMLS on January 26, 2018 and interpreted by Kerry Lucasse with the Urban Nest Atlanta Real Estate Group at eXp Realty. All information is deemed reliable but is not warranted, as it is subject to change. If you would like the complete report of Ormewood home sales (including photos of each home sold), please text or call Kerry at 404-432-1844.
.


