


GRANT PARK HOME SALES REPORT
3Q 2019 Market Stats, Home Values + Recently Sold Homes in Grant Park Atlanta
It’s time again for the Grant Park home sales and real estate market update! Even with the extremely HOT weather, home buyers were still out shopping this quarter. You’ll see below that home sales were up substantially from the same time last year, but it definitely took longer to sell a home and the average sales price took a fairly serious nosedive when comparing the previous year. Hope you enjoy the latest Grant Park Home Sales Report and if you have questions after reviewing, please don’t hesitate to reach out to us at 404-205-8800 or 404-432-1844.
3Q 2019 Overview of Grant Park Home Sales
Home Sales
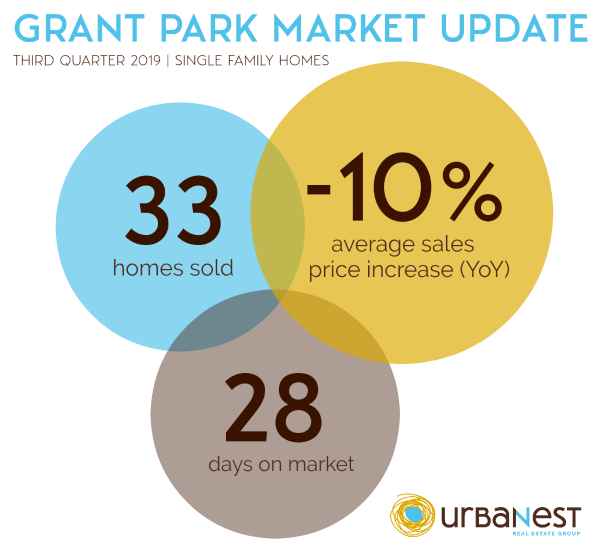
A total of 33 ingle family homes sold in Grant Park in the third quarter (July – September) of 2019. This is way up from the same time last year when only 25 homes sold.
Home Prices + Values
The average single-family home price was $485,462 – this is down 10.2% from the same time last year when it was $546,744. This $61,000 drop isn’t necessarily something we should be super concerned with because prices can fluctuate dramatically when only two or three dozen homes sell each quarter. We do recommend watching the market very closely if you are planning to put your home on the market over the next year.
- Grant Park home prices ranged from $265,000 to $799,000 in3Q 2019
- The median sales price was $489,000 (down from $518,000 last year)
- There were several recently renovated homes that sold in Grant Park (zip code 30312), but only two home sales were newly constructed homes.
Are Buyers STILL Paying Top Dollar?
Yes and no. For those homeowners that price/stage/market their home correctly when it is first listed, homes are selling at or over the asking price. For those home sellers that push the envelope a bit on the listing price and/or don’t make their home ‘showroom ready,’ buyers are negotiating 2% to 3% more off the asking price than they in previous years.
The average list price to final sales price was 96.6%, so buyers were negotiating about 3.4% off the asking price.
At the same time last year, buyers were only getting an average of 1.2% off the asking price.
Even though 3.4% vs 1.2% may not sound like a lot, but if you are selling a $500K home, 3.4% would mean that you are taking $17,000 off the asking price – a difference of $11,000!
How Fast Are Grant Park Homes Selling?
A the same time last year, Grant Park homes sold in an average of 29 days, but this quarter it took 43 days — that’s two weeks longer to sell a home!
The median time on the market was 28 days vs 17 last year.
As we mentioned above, for those homeowners that priced/prepared/marketed their home correctly when it was first listed, they sold quickly. 36% of the Grant Park homes sold in the first week.
SELLER TIP:
If you aren’t sure what the true market value of your home is, we recommend NOT looking at your Zestimate, but calling three local real estate agents and asking them to do a quick 10-minute tour of your home. Before they tour your home, pull together a list of recent upgrades and/or benefits your home offers – this will be a bit help to the real estate agents when determining the value of your home.
You can also get a ballpark idea of your home’s current value with the Urban Nest “no strings attached” home valuation report. Get yours today.
Grant Park Home Sales
Single Family Homes Sold between 7/1/2019 to 9/30/2019
| ADDRESS | BEDS | BATHS | LIST | SOLD | DOM | |
| 815 | Mercer St | 4 | 3 | $799,900 | $799,900 | 101 |
| 780 | Mercer St | 4 | 3.5 | $739,000 | $700,000 | 213 |
| 383 | Georgia Ave | 5 | 3 | $699,900 | $650,000 | 79 |
| 319 | Saint Paul | 4 | 2.5 | $625,000 | $608,000 | 107 |
| 625 | Cameron | 5 | 3 | $639,000 | $605,000 | 44 |
| 657 | Killian St | 4 | 2 | $599,900 | $599,000 | 2 |
| 288 | Milledge Ave | 4 | 3 | $599,000 | $594,000 | 4 |
| 696 | Rosalia St | 3 | 2 | $575,000 | $577,500 | 3 |
| 649 | Delmar Ave | 3 | 2 | $525,000 | $565,000 | 4 |
| 630 | Rosalia St | 3 | 2 | $559,000 | $550,000 | 9 |
| 547 | Broyles St | 3 | 2 | $549,900 | $545,000 | 3 |
| 599 | Cameron | 3 | 2 | $515,000 | $527,504 | 2 |
| 701 | Hansell | 3 | 2 | $535,000 | $520,000 | 44 |
| 321 | Glenwood | 3 | 2.5 | $599,000 | $518,500 | 49 |
| 363 | Woodward Ave | 3 | 3 | $450,000 | $510,000 | 201 |
| 225 | Glenwood Ave | 4 | 4.5 | $549,000 | $499,000 | 52 |
| 363 | Oakland | 5 | 3 | $489,000 | $489,000 | 3 |
| 777 | United Ave | 3 | 2 | $450,000 | $477,000 | 6 |
| 354 | Oakland Park | 3 | 2.5 | $445,000 | $445,000 | 11 |
| 245 | Georgia Ave | 2 | 1 | $439,000 | $439,000 | 7 |
| 99 | Richmond St | 3 | 3 | $449,900 | $427,000 | 65 |
| 650 | Killian St | 3 | 2 | $425,000 | $425,000 | 26 |
| 540 | Broyles St | 2 | 1.5 | $415,000 | $415,000 | 3 |
| 721 | United Ave | 3 | 2 | $499,900 | $414,500 | 77 |
| 845 | Marion | 3 | 2 | $439,900 | $410,000 | 28 |
| 696 | Woodward Ave | 2 | 2 | $424,900 | $400,000 | 63 |
| 160 | Fulton Way | 3 | 2.5 | $395,000 | $395,000 | 3 |
| 560 | Reed St | 3 | 3 | $425,000 | $394,850 | 54 |
| 372 | Glenwood Ave | 3 | 1 | $400,000 | $350,000 | 34 |
| 390 | Broyles St | 2 | 2 | $350,000 | $325,000 | 16 |
| 648 | Home Ave | 3 | 1 | $279,900 | $290,000 | 4 |
| 713 | United Ave | 2 | 1 | $350,000 | $290,000 | 45 |
| 383 | Chastain St | 2 | 2 | $319,900 | $265,500 | 69 |
PLEASE NOTE:
Grant Park Atlanta real estate market home sale stats for 3Q 2019 were extracted from the Atlanta MLS (FMLS) on October 9, 2019, and interpreted by Kerry Lucasse with the Urban Nest Real Estate Group at eXp Realty LLC. Information deemed accurate but is subject to change. Please note that in the chart above, “DOM” just means “Total Days on Market” or how long it took the home to sell.
If you would like a copy of the full Grant Park home sales report, including photos of the recently sold homes, please text or call Kerry at 404-432-1844. She would be happy to email you a copy!